
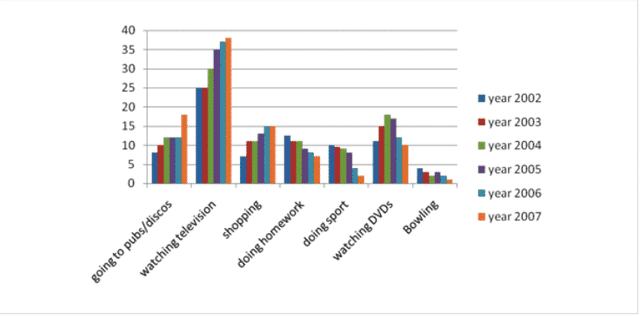
The bar chart reveals the data of
teenagers
, who spent Use synonyms
time
doing several activities in Chester from 2002 to 2007
Use synonyms
Overall
, it could be observed that Linking Words
teenagers
spent a lot of Use synonyms
time
watching Use synonyms
television
, Use synonyms
while
they spent a short Linking Words
time
bowling from 2000 to 2007. Use synonyms
Moreover
, the spent Linking Words
time
going to pubs, watching Use synonyms
television
and shopping gradually increased in the given period, Use synonyms
while
doing homework and doing sport decreased from 2000 to 2007
Linking Words
According to
the chart, the Linking Words
time
spent on the activities of watching DVDs, and bowling, which was done by Use synonyms
teenagers
, was not stable in a given period. Use synonyms
Furthermore
, the Linking Words
time
spent on bowling activities from 2002 to 2007 did not reach 5 Use synonyms
hours
, Use synonyms
while
watching Linking Words
television
reached the peak hour. Use synonyms
In addition
, watching Linking Words
television
approximately reached 38 Use synonyms
hours
by 2007.
Use synonyms
On the other hand
, Linking Words
teenagers
started spending below 10 Use synonyms
hours
going to pubs and shopping in 2002. Use synonyms
However
, late in ,2004 both exceed 10 Linking Words
hours
.Use synonyms