
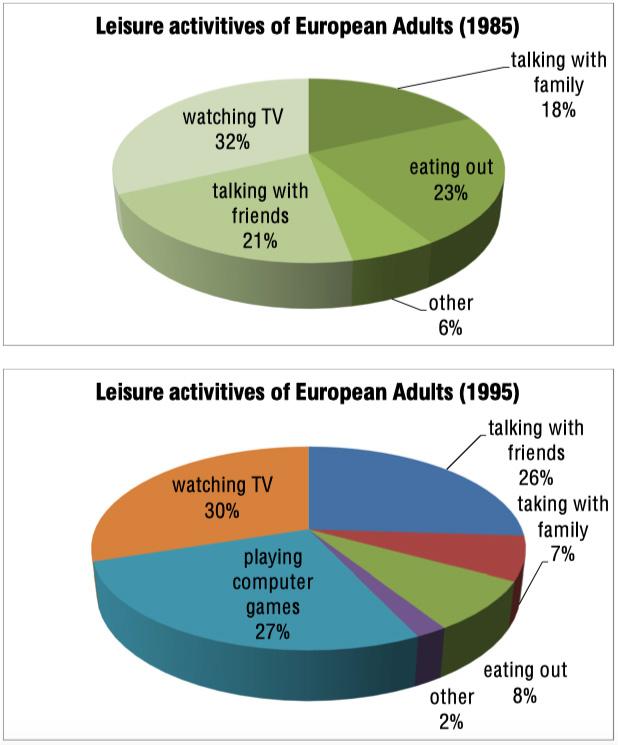
The two pie charts below illustrate
outcome
of the research Add an article
the outcome
in
Change preposition
on
percentagewise
Correct your spelling
percentage-wise
percentages
about
European Change preposition
of
adults
activities in their free time in two Change noun form
adult's
adults'
yers
1985 and 1995.
Correct your spelling
years
Overall
, Linking Words
it is clear that
watching TV was the most significant part of their leisure time in both yearsLinking Words
,
Remove the comma
apply
while
talking with friends was substituted by playing computer games in 1995.
In 1985 watching TV (32%) was the most popular activity among Linking Words
the
adult's society in Europe, Correct article usage
apply
then
Linking Words
on
Change preposition
in
the
second Correct article usage
apply
place
there is Add a comma
,place
an
eating out which makes up 23% of the Correct article usage
apply
chart
. Use synonyms
Moreover
, talking with friends was Linking Words
on
Change preposition
in
the
third place with Correct article usage
apply
Correct article usage
a percentsge
percentsge
rate of 21%. Talking with family and other activities made up Correct your spelling
percentage
smallest
part of the Add an article
the smallest
chart
.
In 1995 watching TV (30%) has remained people's favourite activity as it was in 1985. It is interesting to note that within a span of 10 years playing computer games became Use synonyms
second
Correct article usage
the second
enjoyable
activity in Europe with 27%, it totally took Correct quantifier usage
most enjoyable
a
place of spending time with friends which in 1995 made up 26% of the Correct article usage
the
chart
. Use synonyms
Furthermore
, talking with family, eating out and other activities were the smallest segment of the supplied Linking Words
chart
.Use synonyms