
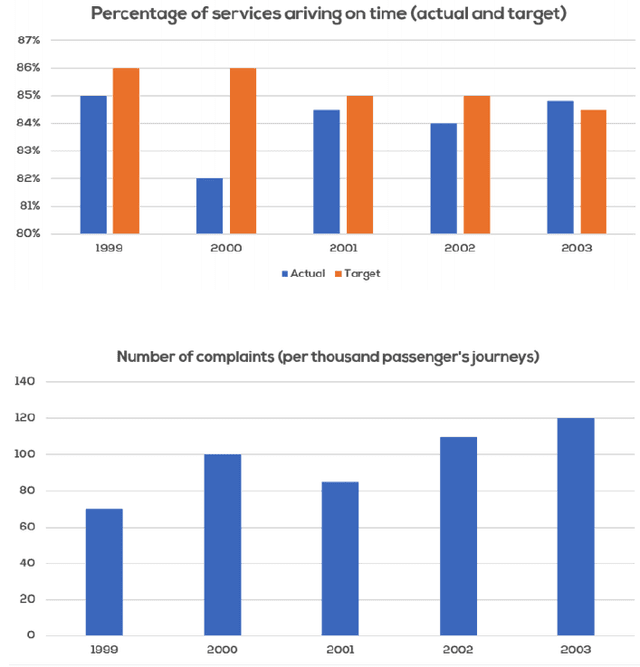
The first bar chart illustrates the
percentage
of services arriving on Use synonyms
time
of a Use synonyms
bus
Use synonyms
company
which is divided into the actual Use synonyms
time
of the buses arriving and the target in terms of punctuality the Use synonyms
bus
Use synonyms
company
tried to achieve. The second bar chart shows the Use synonyms
number
of Use synonyms
complaints
per thousand passenger journeys against the Use synonyms
bus
Use synonyms
company
between 1999 and 2003.
Use synonyms
Overall
, the Linking Words
percentage
of services arriving on Use synonyms
time
as the target is almost always higher than the Use synonyms
percentage
of the actual punctuality of the Use synonyms
bus
Use synonyms
company
. Only Use synonyms
at the end
of the period, did the Linking Words
bus
Use synonyms
company
outrace the target. The Use synonyms
number
of Use synonyms
complaints
rises and falls throughout the period.
In both years 1999 and 2000, the targeted Use synonyms
percentage
of services arriving on Use synonyms
time
was 86, Use synonyms
while
the actual arrival rate was first 85% and in the following year 82%. The year 200 shows the biggest difference between the actual and the targeted performance of the Linking Words
bus
Use synonyms
company
in terms of punctuality.
From 1999 to the year 2003 the Use synonyms
number
of Use synonyms
complaints
experienced a fluctuating increase. Use synonyms
While
in 1999 the Linking Words
number
of Use synonyms
complaints
started at approximately 70 in 2003 almost 120 Use synonyms
complaints
could be counted. Only in 2001, a minimal decline in Use synonyms
complaints
can be observed.Use synonyms