
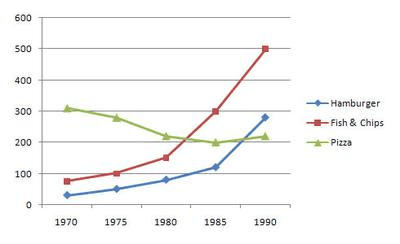
The graph illustrates information about the utilization of fast food, in the UK between 1970 and 1990. Units are measured in
grams
.
From the overview, it is crystal clear that the requirement for fish and chips increased significantly during the given 20 Use synonyms
years
Use synonyms
,
since pizza lovers diminished the eating it, respectively.
In terms of the most significant feature of the chart is seafood and potatoes which Remove the comma
apply
firstly
were required just below 100 Linking Words
grams
in 1970 and had increased gradually, saw its significant hit at 500 Use synonyms
grams
in 1990.
Rolling towards the rest of the information, pizza had been the best seller in 1970 Use synonyms
with
accounting for 300 Change preposition
apply
grams
, Use synonyms
while
after a decade it had lost its selling proportion and remained stable for the next 10 Linking Words
years
.
In regard to other kinds of food, hamburger seems to be the lowest choice in 1970; Use synonyms
however
, Linking Words
it
showed a slight increase in 15 Correct pronoun usage
they
years
and reached just above 100 Use synonyms
grams
and Use synonyms
then
suddenly went up to 300 Linking Words
grams
in 5 Use synonyms
years
.Use synonyms