
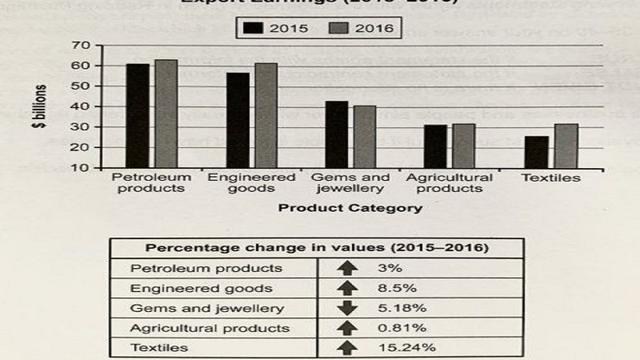
The bar chart below compares the amount of money earned by a particular country by exporting five different categories of
products
in 2015 and 2016. The table illustrates data about the Use synonyms
value
changes of those exported Use synonyms
products
in percentage.
Use synonyms
Overall
, Engineered goods and petroleum Linking Words
products
were the most significant sources of export incomes, in both 2015 and 2016. It is evident that Use synonyms
while
gems and jewellery's Linking Words
value
decreased between 2015 and 2016, all of the other categories witnessed a significant rise in their Use synonyms
value
.
If we look at the bar chart, petroleum Use synonyms
products
were the most valuable exported Use synonyms
products
in 2015, earning almost 60 billion dollars. The amount of money the country earned by selling petroleum Use synonyms
products
to other countries slightly rose by 2016, to just above 60. Engineered goods were providing well under 60 billion dollars for the country in 2016, but the figure jumped to marginally above 60 during the next year.
Looking at the table, it is noticeable that the Use synonyms
value
of textiles exportation has improved considerably, by 15.24%. Despite agricultural Use synonyms
products
, which Use synonyms
value
dropped by almost 5%, the other three categories experienced improvements, ranging from 0.81% and 8.5 over the period in question.Use synonyms