
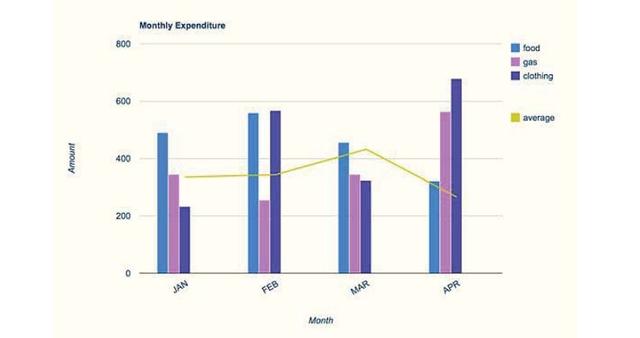
The bar graphs show how much money a family from the USA spend on food, gas and clothes in a four months period, in 2010.
Overall
, Linking Words
while
in January and ,Linking Words
March
the biggest sum of bills was used on food, in February and April clothes represented the category in which families invested the highest amount of money.
Use synonyms
According to
the graph, between January and February, people started spending more cash on food , from around 500 dollars to nearly 600. Linking Words
Also
, in Linking Words
this
period they started spending more on sportswear, from over 200 dollars to more than 550 , and Linking Words
nevertheless
consuming less gas. From February to Linking Words
March
the Use synonyms
overall
spending grew to over 400 dollars , making Linking Words
March
the most expensive month.
Use synonyms
Furthermore
, between Linking Words
March
and April, USA people started wasting more than double the amount of cash on clothes, making April the month with the highest waste in Use synonyms
this
category.Linking Words
Moreover
, gas consumption has increased and foodstuff has decreased.Linking Words