
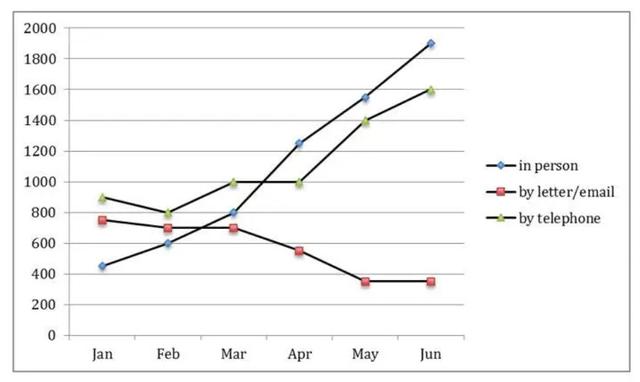
The line chart gives information about the number of tourists claimed for guidelines in terms of three categories (in person, by letter/email ,and by telephone) in a six-month period.
Overall
,people asked for information in person and calling increased in the given time. Linking Words
On the other hand
, tourists who wrote letters or emails to get data dropped between January and June.
There was a significant rise in the number of travellers who asked for guidelines in person. It started at just over 400 in January and was followed by a dramatic rise Linking Words
then
peaked at over 1800 Linking Words
at the end
of the illustrate. The opposite trend was witnessed in the number of by letter/email, which slightly decreased in the first two months and considerably downed to almost 400 in May and remained stable in the Linking Words
last
month.
Linking Words
Besides
, the figure for tourists by telephone experienced a rally at first and reached a plateau of 1000 between May and April. In the Linking Words
last
three months, that gradually climbed to 1600.Linking Words