
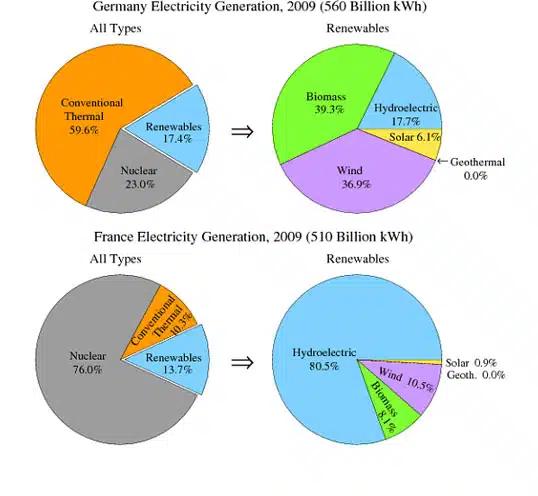
The four pie charts depict the percentage of electricity generation in two different countries from all types and
renewables
in 2009.
Use synonyms
Overall
, Linking Words
it is clear that
the highest proportion in Linking Words
France
was nuclear and Use synonyms
renewables
including hydroelectric made up the highest trend Use synonyms
while
, in Linking Words
Germany
, these types were lower.
It is obviously seen that in 2009, the usage of nuclear was distinguished noticeably that consisted of 23% in Use synonyms
Germany
Use synonyms
while
it was 76% in Linking Words
France
. Use synonyms
In contrast
, conventional thermal made up 59% of German, it showed a downward trend of 10.3% in Linking Words
France
. Use synonyms
According to
the Linking Words
Renewables
, they differentiated only 1% as they consisted of 17.4% and 18.7% respectively in Use synonyms
Germany
and Use synonyms
France
.
Regarding Use synonyms
renewables
which included three different types of electricity, Hydroelectric Power accounted for the largest proportion 80.5% in Use synonyms
France
. Use synonyms
Nevertheless
, Linking Words
this
figure was 17.7% in Linking Words
Germany
. Biomass and wind energy demonstrated larger proportions 39.3% and 36.9% in Use synonyms
Germany
Use synonyms
while
these figures were the lowest points in Linking Words
France
8.1% and 10.5% in Use synonyms
France
. Use synonyms
Besides
that in two countries, solar energy consisted of 6,1% and 0.9% in 2009.Linking Words