
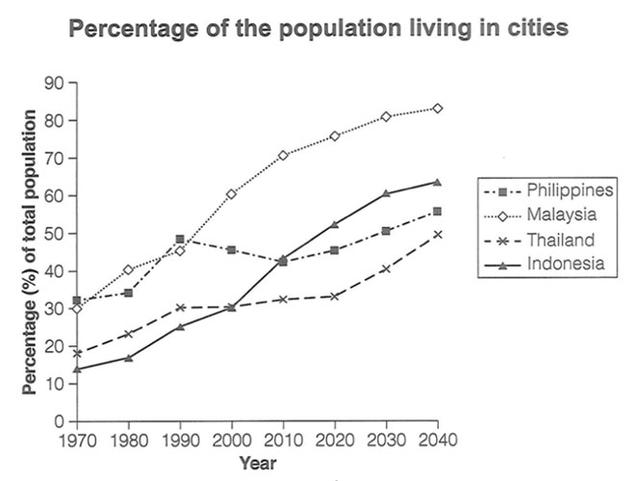
The line graphs illustrate the percentage of the population living in the cities, of the main countries in Asia, including the Philippines, Malaysia, Thailand and Indonesia, between 1970 to 2020. The graphs
also
show the prediction for 2030 to 2040. Linking Words
Overall
the population in the cities are growing from 1970 to 2020 and is predicted to continue Linking Words
growth
in 2040.
Of four countries, Malaysia has continued rapid Use synonyms
growth
from 30% in 1970 to 70% in 2020, followed by Indonesia which had the same pattern of Use synonyms
growth
from 15% in 1970 to 50% in 2020. Use synonyms
On the other hand
, the Philippines had a different pattern, starting with rapid Linking Words
growth
from 30% in 1970 to almost 50% in 1990, Use synonyms
then
slightly bounced back to 40% in 2010, and back to gradual Linking Words
growth
afterwards. Use synonyms
Additionally
, Thailand had smoothly elevated from 1970 to 2020.
For the future prediction, all the numbers are increased Linking Words
growth
from 2030 to 2040. The diagram showed that Malaysia will be on the top of Use synonyms
growth
for almost 80% in 2040, followed by Indonesia in the second place, Use synonyms
then
the Philippines and Thailand in the Linking Words
last
place.Linking Words