
The bar chart shows the comparison of expenditures in a week of households in one country in the years
of
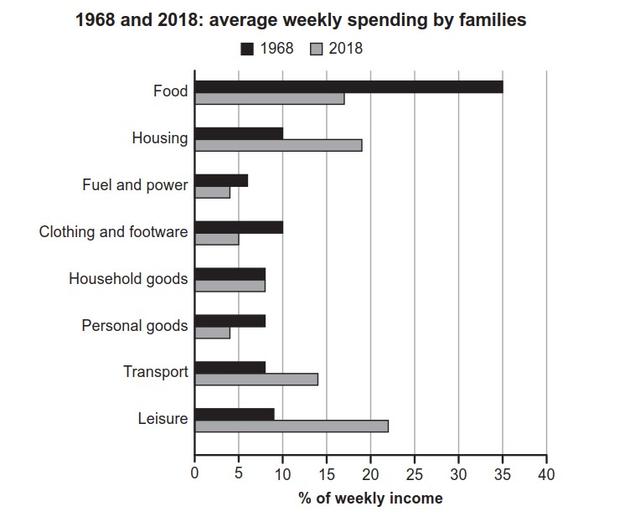
1968 and 2018.
Change preposition
apply
Overall
, in 1968, the majority of families spent most of their money on eating. Linking Words
While
, in 2018, the money was spent mostly on having free time every week.
It is evident from the chart that food was mainly their concern in the year 1968. Around 35% which was the highest percentage of expenditures of families was used for purchasing food. Linking Words
However
, accommodations and clothing and footwear were the second most that families paid, both of them accounting for exactly 10%. Other than that, fuel and electricity, household stuff, private things, transportation and leisure time were roughly around 8 to 10% each.
Linking Words
On the other hand
, food wasn’t the most significant thing for their outcome in the year 2018. There was a dramatic decrease in consumption from 35% to 15%. Linking Words
Moreover
,approximately two in ten people focused more on having their holiday times came to be the most spending money in a week. Even so over 50 years, the amount of gas and power that they paid for, were remained to be the least spending averaging at 5 %.Linking Words