
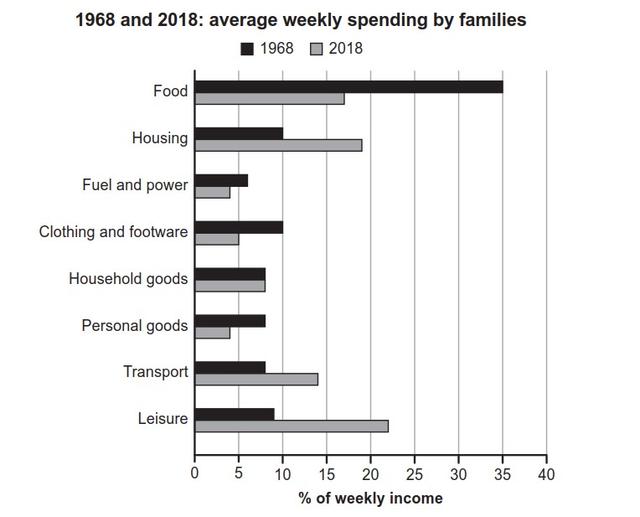
The given bar chart illustrates the average expenditure of families for different categories during one week in
years
1968 and 2018. Correct article usage
the years
Overall
, Linking Words
it is clear that
the spending on various factors changed considerably except for household goods which remained constant for 40 years. Linking Words
Moreover
, individuals tend to spend more money on food in 1968, which was 35 per cent , compared to 2018 , which experienced a significant decrease to about 17 per cent.
As is shown by the chart, Housing followed by Transport and free time activities saw a dramatic increase in 2018 and they were around 19% , 14% and 22%, respectively. The usage of transport Linking Words
such
as public transport vehicles and airplanes doubled in 2018 Linking Words
while
fuel and power witnessed a slight decrease in that year.
In 1968, more people spend their budget on clothing and footwear and its proportion was nearly doubled of its percentage in 2018. Linking Words
Furthermore
, the figures for personal goods plunged two times in 2018.Linking Words