
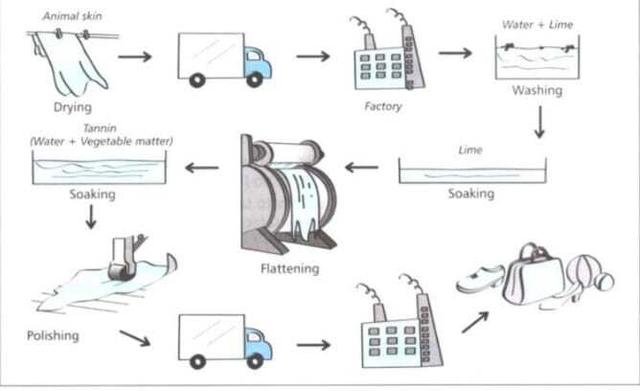
The photo illustrates how animal skin is turned into usable leather.The manufacturing process involves drying, soaking, washing, and so on. Before they become available in the market, they go through a thorough sequential method, which starts with drying and ends on the shelves for consumers.
Firstly
, the animal hide is hung and dried until it is ready to be transported to the factory, and washed with water and lime to remove the unwanted materials. After the washing stage, soaking will be the next step, which is done to soften the material. Linking Words
Next,
through the use of a flattening machine, the skin goes through in between to obtain a smoother look.
At Linking Words
this
point, the flattened material is submerged with tanning agents, Linking Words
such
as water and vegetable matter, making it water-resistant and free from decay. Polishing the wildlife hide, which is now the leather, is the final step of the entire process, wherein a rolling tool is used over it until they tranship them to the assembling factory, where they will shape and cut them, Linking Words
then
eventually turn them into a bag, shoes, wallets, etc. Linking Words
This
Linking Words
also
serves as the quality control stage, wherein the leather will be assessed if they meet the standards of end users.Linking Words