
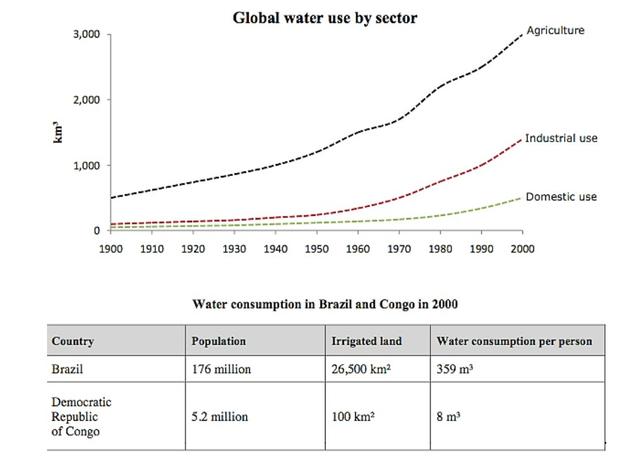
The graph shows how the number of drinks used worldwide. Between 1900 and 200. The agriculture sector was the largest section that uses water at the beginning of
this
period was 500 Linking Words
km
but after ,that it significantly increased which achieved 3000 Use synonyms
km
in 2000. When it comes, to water used in the industrial and the domestic section, the graph shows From 1990 to 1980 it remained steady which was around o Use synonyms
km
but in 1960 the industrial port exceeded that of the domestic it accounted for 1000 Use synonyms
km
Use synonyms
while
the domestic arrived at 300 Linking Words
km
.
The table gives information on differences in agriculture consumption in Use synonyms
Brazil
and Use synonyms
Congo
, irrigated land in Use synonyms
Brazil
was by far the most used drink compare with Use synonyms
Congo
, It was 26500 in Use synonyms
Brazil
Use synonyms
while
the figure was 100 Linking Words
km
in Cong Use synonyms
also
there are a lot of people live in Linking Words
Brazil
(176 miles)but in Use synonyms
Congo
consisted 8.2 million, as in consequence everyone in Use synonyms
Brazil
which consumption of water in Use synonyms
Brazil
should be more than in Use synonyms
Congo
(382 m For Use synonyms
Brazil
and 8 m is Use synonyms
Congo
)Use synonyms