
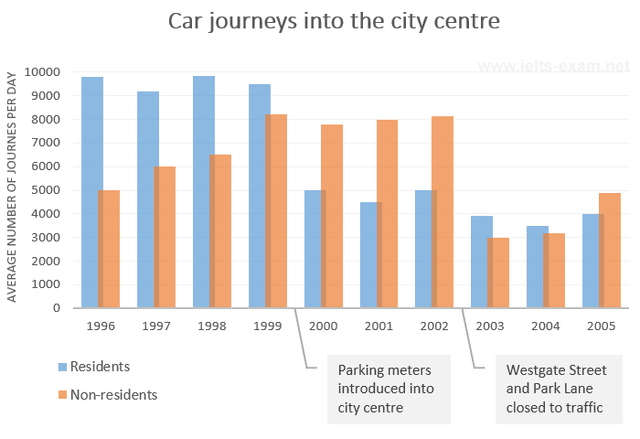
The bar chart illustrates the data on the
number
of car journeys into the city centre in two different aspects which are from Use synonyms
residents
and non-Use synonyms
residents
from the Use synonyms
year
1996 until 2005.
Use synonyms
Overall
, the Linking Words
number
of car journeys made by Use synonyms
residents
outnumbered the non-Use synonyms
residents
in the 1990s era and it decrease as it enter the Use synonyms
year
of 2000s because the introduction of parking meters. Use synonyms
On the other hand
, non-Linking Words
residents
have a stable increase in the years 1990s and a slight fall when entering the Use synonyms
year
2000 continued by a dramatic fall in 2003 as Westgate Street and Park Lane are closed to traffic.
Use synonyms
Initially
, the Linking Words
residents
used their cars a lot before parking meters were introduced. The Use synonyms
number
of journeys was approximately reaching 10000 but it fluctuated by 5000 people and barely made changes in the numbers. Use synonyms
Then
,the fall continue by 1000 in 2003 and it does not have many changes as the maximum Linking Words
number
of Use synonyms
residents
using their cars is 4000 people.
Use synonyms
Furthermore
, for non-residential, the Linking Words
number
mushroomed about 2 times from 4000 to 8000 in the first Use synonyms
year
period. But the numbers have a slight drop in the Use synonyms
year
2000 by 200 but they made a comeback in the Use synonyms
year
2002. Use synonyms
Moreover
, they had a sharp dive in numbers in 2003 as it decrease to 3000 and made a slight increment in the Linking Words
year
2005.Use synonyms