
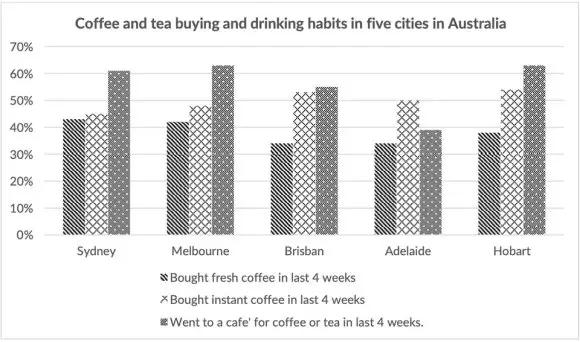
The diagram describes the outcome of a survey of the human buying behaviour of
tea
and Use synonyms
coffee
from five different regions in Australia. The survey was collected from three types of Use synonyms
people
, ones who brought fresh Use synonyms
coffee
, ones who brought Use synonyms
instant
Use synonyms
coffee
and ones who went to a Use synonyms
coffee
or Use synonyms
tea
shop in the Use synonyms
last
four weeks. Linking Words
Overall
, most Linking Words
people
from Sydney, Melbourne and Hobart prefer to have Use synonyms
coffee
or Use synonyms
tea
by visiting Use synonyms
coffee
or Use synonyms
tea
shops.
Use synonyms
To begin
, buying fresh Linking Words
coffee
is the least choice of Use synonyms
people
in five Australian cities. In Sydney and Melbourne, the number of Use synonyms
people
buying fresh Use synonyms
coffee
was just about 40%. Use synonyms
While
in Linking Words
Brisbane
and ,Adelaide the percentage dropped to around 35%. Use synonyms
Then
, in Linking Words
Hobart
the ratio has a slight rise to just below 40%.
Purchasing Add a comma
,Hobart
Instant
Use synonyms
coffee
is preferable for Use synonyms
people
from Adelaide, exactly 50% of Use synonyms
people
from the survey brought Use synonyms
instant
Use synonyms
coffee
. Use synonyms
However
, if compared to Linking Words
Brisbane
, Adelaide has fewer numbers than Use synonyms
Brisbane
but not too many, just a slight. The consumption of Use synonyms
Instant
Use synonyms
coffee
in Use synonyms
Brisbane
reached above 50% but most Use synonyms
people
of Use synonyms
Brisbane
still prefer to go to Use synonyms
coffee
or Use synonyms
tea
shops.Use synonyms