
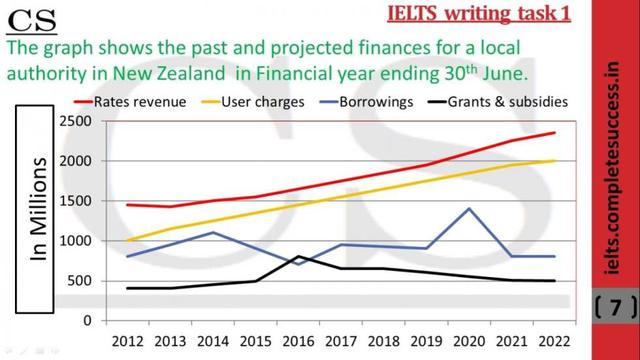
The graph describes the past and projected economy for a local authority in New Zealand.
This
writing will state the trends and the details and compare them when necessary.
In the overview, all categories reach a higher number Linking Words
at the end
of the graph, some categories increase stagnantly, Linking Words
while
some are fluctuative.
To start with, the rates Linking Words
revenue
and user charges were climbing constantly throughout the year, reaching about 2,400 and 2,000 million dollars, respectively, in 2022, Change preposition
of revenue
thus
, they both added about 1,000 million dollars to their initial values in 2012. Linking Words
Moreover
, they constantly have 800,000 dollars difference Linking Words
with
each other.
Change preposition
from
Second,
borrowing value fluctuates as time Linking Words
went
by, resulting in a lower amount of cash Wrong verb form
goes
at the end
of 2022 than in 2012, Linking Words
in contrast
to grants and subsidies that are capable of getting a higher number Linking Words
at the end
. Linking Words
In addition
, grants and subsidies had their peak in 2016, Linking Words
while
borrowings had their minimum point.Linking Words