
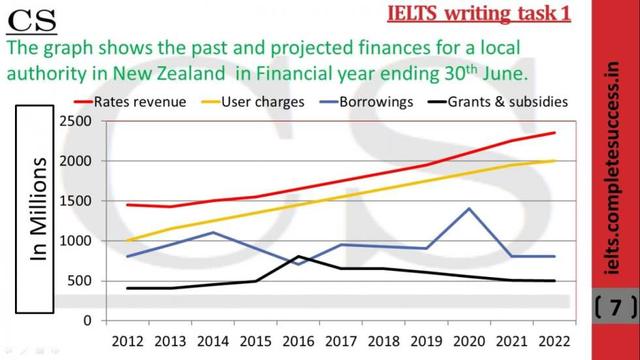
The given graph chart displays the past and projected finances for a local authority in New Zealand.
Overall
, Rates revenue and User charges are increasing equally and gradually for around 2,0-2,5 Linking Words
million
Use synonyms
dollars
. Use synonyms
Whereas
, Borrowings was maintaining mostly between 800-900 Linking Words
million
Use synonyms
dollars
from 2012 to 2022 on average. But Borrowings were bumpy from 800 to nearly 1,500 Use synonyms
million
Use synonyms
dollars
between 2019 and 2020 and decreased less than by 1,000 Use synonyms
million
Use synonyms
dollars
. Use synonyms
And
Grants and subsidies increased gradually from below 400 to nearly 500 Correct word choice
apply
million
Use synonyms
dollars
between 2012 and 2022, but it was bumpy nearly 800 Use synonyms
million
Use synonyms
dollars
in 2016 and was falling again below 600 Use synonyms
million
Use synonyms
dollars
and it decreased gradually from 800 to 500 Use synonyms
million
Use synonyms
dollars
between 2016 and 2022.
In conclusion, Rates revenue and User charges were increasing gradually year after year without being bumpy, Use synonyms
by contrast
, Borrowings, Grants and subsidies were bumpy and going to be steady.Linking Words