The line graph below shows the household recyclling rates in three different countries between 2005 and 2015. Summarize the information by selecting and reporting the main features, and make comparisons where relevant.

The line graph below shows the household recyclling rates in three different countries between 2005 and 2015.

Summarize the information by selecting and reporting the main features, and make comparisons where relevant.
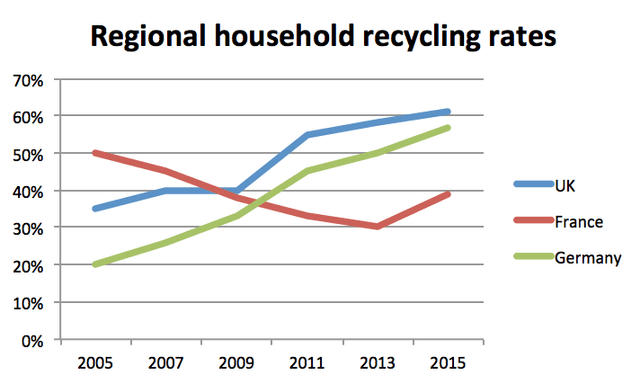
The graph gives information about the domestic recycling proportion in the UK, France and
Germany
, over the time period between 2005 and 2010.
Overall
, what stands out from the figure is that there were considerable upward trends in the percentage of both England and
Germany
,
while
it showed a considerable fall in the household recycling rates over the period, in question. Another interesting point is that
,
Remove the comma
apply
show examples
Germany
was the lowest country
at
Change preposition
in
show examples
the domestic recycling system in 2005, but in 2010 the UK recycled more than the other two countries. Looking at the details, as regards
Germany
UK started from 37% in 2005, and the figure rose gradually until 2007, at which point it levelled off at just 40% over the next two years.
Then
there was a significant upward trend until 2011 and again the figure showed
gradual
Add an article
a gradual
show examples
increase.
However
, the trend was the same in
Germany
.
Having
Verb problem
There was
show examples
a significant rise up to 2009, reaching around 42% in 2011.
Moreover
Add a comma
,Moreover
show examples
in the
last
four
years
Add a comma
,years
show examples
the rate rose
up
Change preposition
apply
show examples
gradually.
By contrast
, the rate of household recycling went in the opposite direction in France. Gradually decreased from the start to 2013, it
then
significantly rose up to 40% over the next two years.
Submitted by skn  on

Unauthorized use and/or duplication of this material without express and written permission from this site’s author and/or owner is strictly prohibited. Excerpts and links may be used, provided that full and clear credit is given to Writing9 with appropriate and specific direction to the original content.

Sentences: Add more complex sentences.
Vocabulary: Replace the words germany with synonyms.
Vocabulary: Rephrase the word "information" in your introduction.
Vocabulary: The word "figure" was used 3 times.
Vocabulary: The word "showed" was used 2 times.
Vocabulary: The word "trends" was used 3 times.
Vocabulary: The word "gradually" was used 4 times.
Vocabulary: The word "significant" was used 3 times.
Vocabulary: The word "considerable" was used 2 times.
Topic Vocabulary:
  • line graph
  • household recycling rates
  • trend analysis
  • comparison
  • significant
  • increase/decrease
  • fluctuations
  • plateau
  • progress
  • environmental implications
  • rate
  • peak
  • upward/downward trend
  • percentage
  • consistently
  • period
  • surpass
  • level off
  • stagnate
  • benchmark
  • time frame
  • sustainable practices
  • waste management
  • recycle
  • dispose
  • landfill
  • renewable resource
  • conservation
  • eco-friendly
  • green initiative
What to do next:
Look at other essays: