
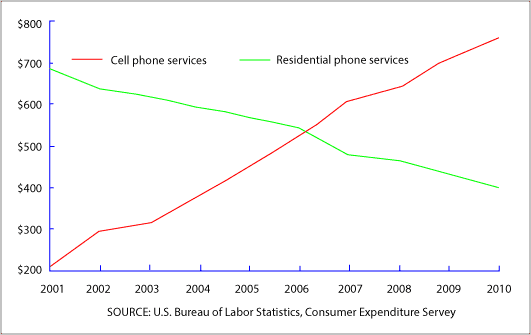
The line graph compares the data about the average spending money in a year on residential
phone
Use synonyms
services
and cell Use synonyms
phone
Use synonyms
services
by American consumers over a period of ten years from 2001 to 2010.
From the figures, it can be inferred that residential Use synonyms
phone
Use synonyms
services
experienced a dramatic rise. In stark contrast, residential Use synonyms
phone
Use synonyms
services
saw a significant decline in expenditure in these ten years. Use synonyms
Also
, it is noticeable that in the year 2006, both communication tools comprised the same amount of money by individuals.
In 2001, landline utilization stood at 700$ and accounted for a steady fall. Linking Words
On the other hand
, Linking Words
according to
labour statistics, consumption of mobile began from just over 200$ and increased by 100$ in 2002. Linking Words
Following
Linking Words
this
, contained a smooth increase, and reached roughly 310$ in 2003. After that, climbed sharply to reach approximately 530$ in 2006 as same as landline expenditure.
Following the year 2006, both of them divided into two different trends, and the average yearly expenditure on landlines dropped by nearly 100$ and stopped at 420$ in 2010. Linking Words
In addition
, the consumption of wireless phones soared to around 780$.Linking Words