
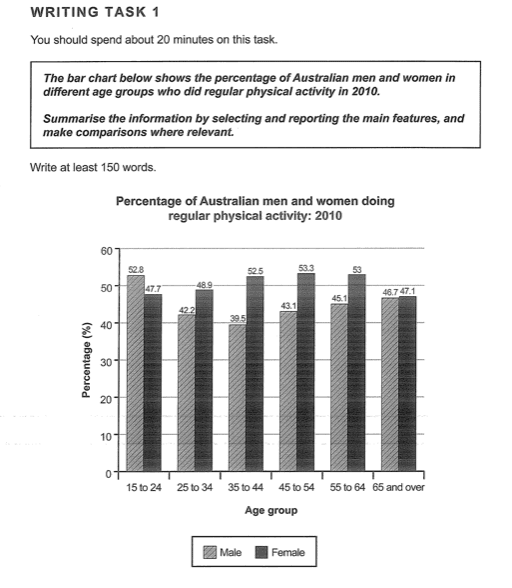
The given bar chart provides information regarding the percentage of both Australian male and female individuals having physical activity in various
age
groups in 2010.
It is noticeable to see that more women between the ages of 25 to 64 had physical activities than men their Use synonyms
age
, Use synonyms
while
these figures roughly crossed in their older ages (65 and over).
52.8% of young males from 15 to 24 worked out frequently, and as they grew older Linking Words
this
figure decreased, reaching 39.5% at the Linking Words
age
of 35 to 44. Use synonyms
However
, after the Linking Words
age
of 45, their physical activities rose, and by the Use synonyms
age
of 45 to 54, 43.1% of them had regular physical activities.
Use synonyms
Whereas
, only 47.7% of females aged 15 to 24 had constant physical activity, which was less than males, but Linking Words
this
figure leveled up as they aged, and reached its highest point of 53.3% at the Linking Words
age
of 45 to 54. Use synonyms
Additionally
, Linking Words
this
figure fell from 55 and over.Linking Words