
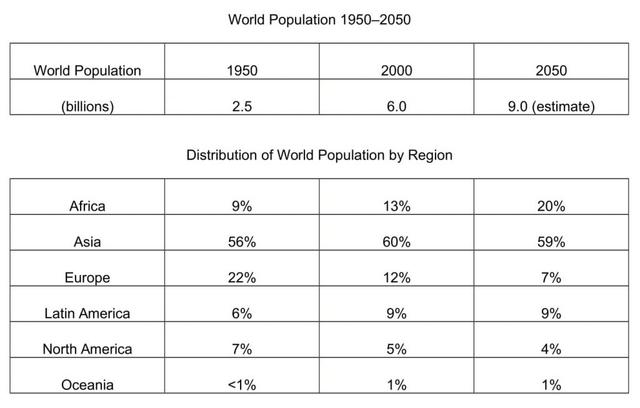
The data provided in the form of tables illustrate the number and proportion of people who lived in the
world
and in each continent in 1950 and 2000, with the projection of 2050.
Use synonyms
Overall
, there was an upward trend in the Linking Words
world
Use synonyms
population
, Use synonyms
although
it is predicted that the speed of Linking Words
population
growth will decrease from 2000 to 2050. Use synonyms
Also
, the pattern of distribution of Linking Words
world
Use synonyms
population
by region does not change significantly, and Asia and Oceania are the most and least populated parts of the globe over the surveyed period.
In 1950, the number of people in the Use synonyms
world
was reported 2.5 billion, which saw a substantial rise of 3.5 billion over the next 50 years with an estimate of 3 billion in 2050.
The percentage of pupils remains approximately constant in all parts of the Use synonyms
world
, except Africa with a more than two times rise and in Europe, it is projected to reach less than half of its number in 1950.
Use synonyms
Additionally
, Asia covered nearly 60% of the Linking Words
world
Use synonyms
population
, Oceania 1% and America continent less than 10%.Use synonyms