
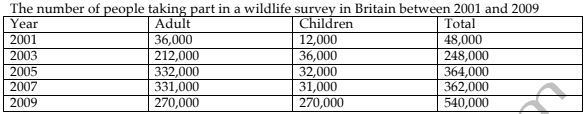
The table provides information about the
number
of individuals involved in Use synonyms
wildlife
surveys during the period from 2001 until 2009 in Britain.
Use synonyms
Overall
, each year has a variable which is the Linking Words
number
of Use synonyms
adults
and children participating in Use synonyms
wildlife
in Britain. Clearly, adult people are more involved in Use synonyms
wildlife
than kids.
Between 2001 and 2009 is easy to identify the fluctuation, in 2001 the Use synonyms
number
of Use synonyms
adults
was 36,000. In 2003 the Use synonyms
number
of Use synonyms
adults
increased considerably. Use synonyms
Instead
, in 2005 and 2007 there was a significant growth of about 100,000 more than in the previous years. Linking Words
Finally
, in 2009 the total of Linking Words
adults
lowed 61000 in the previous years 2005 and 2007 respectively.
Children's variable has a particular tendency. In 2001 just started with 12,000 kids}; Use synonyms
then
, between 2003 and 2007 the variable had a low of about 5,000 people. Linking Words
Finally
, in 2009 kids had the same Linking Words
number
of participants in Use synonyms
wildlife
than Use synonyms
adults
.Use synonyms