
This
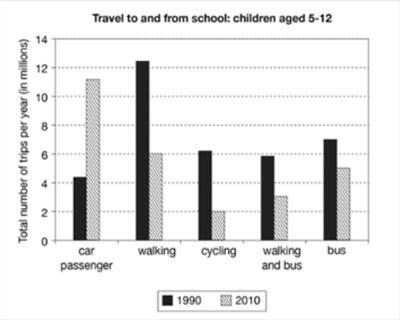
pie chart depicts the figures for travel made by younger people in a nation in 1990 and 2010 to travel to and from school using some modes of transport It is clear from the graph that the most common way to take a trip in 1990 is walking Linking Words
while
in 2010 by car.
Linking Words
According to
what is shown, the total Linking Words
number
of in 1990 by used a car was almost 11 Use synonyms
million
Use synonyms
while
in 2010 was more than 4 Linking Words
million
The Use synonyms
number
of children who walked in that time in 1990 was nearly 2,200,000 and the other year was 6,000,000. Cyclingin 2010 was 2 Use synonyms
million
and in1990 was more than 6 Use synonyms
million
Use synonyms
However
, the Linking Words
number
of walking and bus was almost 6 Use synonyms
million
Use synonyms
while
in 1990 was just half. In 1990 the Linking Words
number
of children who used the bus was 7 Use synonyms
million
Use synonyms
while
in 2010 was 5 Linking Words
million
Use synonyms
To sum up
, we could say that, in 2010 transportation was used more than in 1990 in different modes except car passengers.Linking Words