
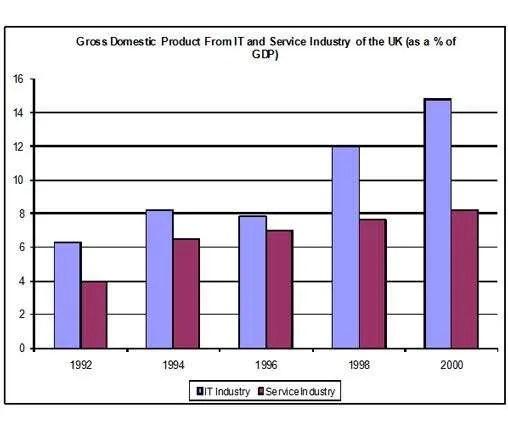
The provided picture offers a comparison of the gross domestic product of industries of IT and services from 1992 to 2000 in the United Kingdom.
Overall
, both industries present an increasing tendency, and the IT Linking Words
industry
shows greater economic development. Being differentiated from the Use synonyms
service
Use synonyms
industry
that grows all the time, the GDP dropped slightly in the IT Use synonyms
industry
in 1996.
Use synonyms
To begin
with, the GDP of IT business started at around 6% and it fluctuated around 8% from 1994 to 1996. The statistic suddenly rocketed to 12% in 1998 and kept increasing to almost 15% in 2000. Linking Words
In contrast
with the Linking Words
service
Use synonyms
industry
, the growth of the IT Use synonyms
industry
is concentrated in the latter 4 years.
Use synonyms
On the other hand
, the Linking Words
service
Use synonyms
industry
shows stable growth periodically. In the beginning, it began at 4 in 1992 and gradually climbed from 6.2% to 8% in the end. To be more specific, the GDP of Use synonyms
service
business was 7.0% and 12% respectively in 1996 and 1998.Use synonyms