The graph below shows the amounts of waste produced by three companies over a period of 15 years. Summarize the information by selecting and reporting the main features, and make comparisons where relevant. Write at least 150 words.

The graph below shows the amounts of waste produced by three companies over a period of 15 years.

Summarize the information by selecting and reporting the main features, and make

comparisons where relevant.

Write at least 150 words.
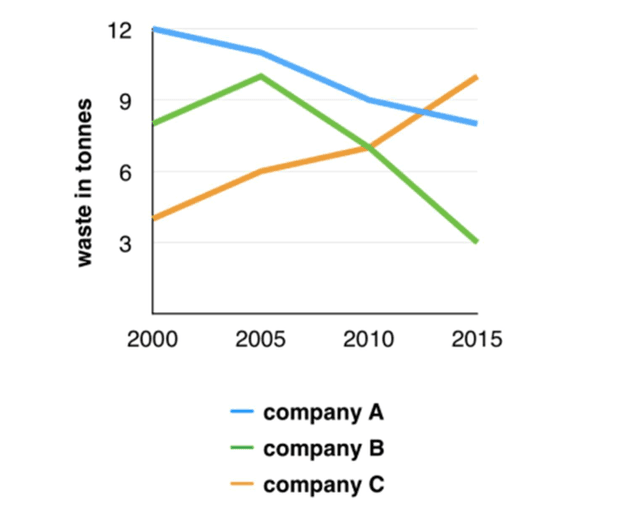
The display graph describes the amount of waste produced by three companies over a period of 15 years. The data is from 2000, 2005, 2010 and 2015. The below information on waste is in tonnes by three firms.
Company
C in 2000 it was more than 3,
then
by 2005 it was around 6,
then
by 2010 it was increased by 7 and in 2015 it was highest with 9.
Company
A in 2000 it was 12
then
by 2005 it was nearby 10, in 2010 it was 9 and in 2015 it was 8.
Company
B, in 2000 it was around 8
then
it increased in 2005 by 10, in 2010 it was 7. The
company
C kept on growing from 2000 to 2015.
To conclude
, the above information describes
about
Remove the preposition
apply
show examples
the waste in tonnes by three
company
name
Fix the agreement mistake
names
show examples
with
Change preposition
apply
show examples
company
A,
company
B
as well
as
Correct word choice
and
show examples
company
C.
Submitted by purvaam383 on

Unauthorized use and/or duplication of this material without express and written permission from this site’s author and/or owner is strictly prohibited. Excerpts and links may be used, provided that full and clear credit is given to Writing9 with appropriate and specific direction to the original content.

Vocabulary: Rephrase your introduction. Words match: 82%.
Vocabulary: Replace the words company with synonyms.
Vocabulary: The word "describes" was used 2 times.
Vocabulary: The word "information" was used 2 times.
Vocabulary: The word "increased" was used 2 times.
Vocabulary: The word "around" was used 2 times.
What to do next:
Look at other essays: