
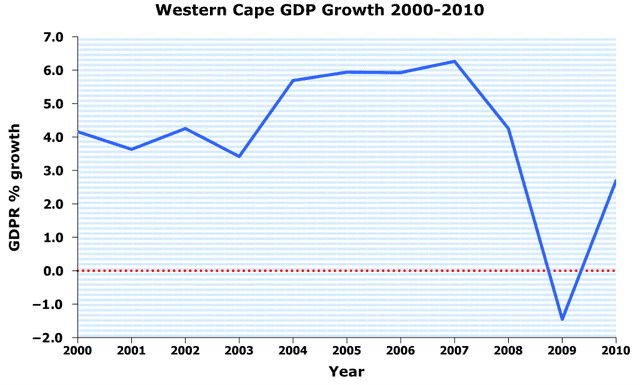
The diagram illustrates the evolution of the average growth of domestic products among all European countries over a span of 10
years
.
Clearly, the data experiences fluctuations in Use synonyms
this
period, characterized by an alternating trend in the first 4 Linking Words
years
, a relatively stable rise in the following 3 Use synonyms
years
, and dramatic changes in the Use synonyms
last
3-year period.
To be more specific, the data starts from 4.1% in 2000, after several Linking Words
years
of evolution, and stops at 5.5% in 2004. From 2004 to 2007, the general GDP has steadily grown by 0.7, fixed at 6.2%. Use synonyms
However
, from 2007 to 2009, the data point significantly Linking Words
drops
7.7 and Wrong verb form
dropped by
reaches
the lowest level during Wrong verb form
reached
this
duration (-1.5%), followed by a subsequent surge, and eventually stabled at 2.5%.
Linking Words
To sum up
, the Linking Words
overall
pattern of the Western average GDP has witnessed notable changes throughout the first decade of the 21st century, particularly in the Linking Words
last
three Linking Words
years
. The growth point in 2010 is lower than that at the beginning of the period.Use synonyms