The chart below gives information about how families on one country spent their weekly income 1968 and in 2018

The chart below gives information about how families on one country spent their weekly income 1968 and in 2018
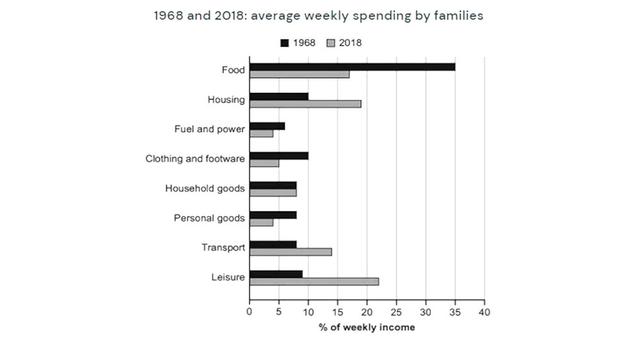
The bar chart illustrates the expenditure of families with their weekly income in a specific country in 1968 and 2018.
Overall
, in 1968, people spent the most on food,
whereas
they spent the least on fuel and power. In 2018, the maximum percentage was for leisure and the minimum one was for transport. The proportion of food group and clothing and footwear was respectively 35% and 10% of the income in 1968,
while
their relative number dropped drastically to half of its first value in 2018. People spent almost 6% of their salary on fuel
and
Correct word choice
apply
show examples
power group and personal goods group in 1968.
Although
,
Remove the comma
apply
show examples
the expenditures for both groups decreased in 2018, they had an insignificant change. Communities allocated less than 10% of their income to leisure, transport and housing in 1968. After 50 years, the percentages of these groups jumped drastically as their relative value almost became two times their initial percentages. Families allocated an equal amount of money to household goods during the period.
Submitted by zbafshar92 on

Unauthorized use and/or duplication of this material without express and written permission from this site’s author and/or owner is strictly prohibited. Excerpts and links may be used, provided that full and clear credit is given to Writing9 with appropriate and specific direction to the original content.

Sentences: Add more complex sentences.
Vocabulary: Rephrase your introduction. Words match: 67%.
Vocabulary: The word "percentage" was used 3 times.
Vocabulary: The word "almost" was used 2 times.
Topic Vocabulary:
  • Weekly income
  • Expenditure
  • Consumption patterns
  • Cost of living
  • Discretionary spending
  • Inflation
  • Economic indicators
  • Demographics
  • Socio-economic factors
  • Technology advancements
  • Government policies
  • Consumerism
  • Lifestyle changes
  • Fiscal habits
  • Budget allocation
  • Financial priorities
  • Societal trends
  • Purchasing power
  • Income distribution
What to do next:
Look at other essays: