
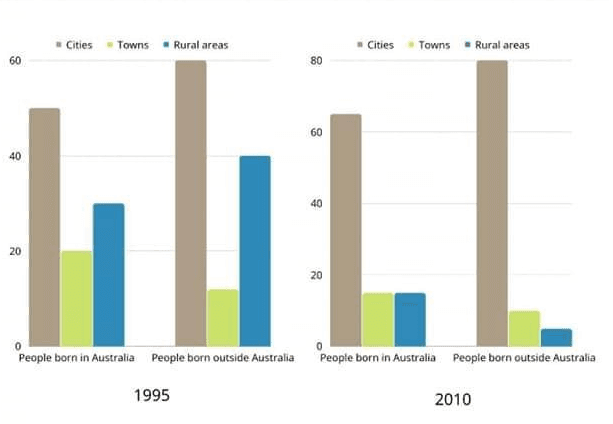
The bar graph illustrates the changes in the
number
of Use synonyms
people
born inside and outside of Australia living in urban, rural and towns in 1995 and 2010.
Use synonyms
Overall
, what stands out from the data is that the majority of Linking Words
people
are from the Use synonyms
cities
in both Australia and outside of the country Use synonyms
while
the Linking Words
people
born in rural areas account for the lowest Use synonyms
number
.
In more detail, in 1995 the Use synonyms
number
of Use synonyms
people
from the Use synonyms
cities
that came outside the nation had the highest value at exactly 60% compared to the citizens born in Australian Use synonyms
cities
at over 40%. Use synonyms
Moreover
, those who are from the countryside outside the country have the lowest figure at just under 20% Linking Words
in contrast
those who are from town inside Linking Words
is
at 20%
Unnecessary verb
apply
On the other hand
, in 2010 citizens from the Linking Words
cities
still had the majority Use synonyms
number
of the population for both areas inside and outside (at 80% and just over 60%, respectively). Unexpectedly, the Use synonyms
number
of Use synonyms
people
from the town and rural areas in both places only reached a small percentage at under 20%.Use synonyms