The flow chart illustrates the consequence of deforestation. Summarise the information by selecting and reporting the main features.

The flow chart illustrates the consequence of deforestation. Summarise the information by selecting and reporting the main features.
IELTS Writing Task Chart for The flow chart illustrates the consequence of deforestation. Summarise the information by selecting and reporting the main features.
✨ Do you want to improve your IELTS writing?
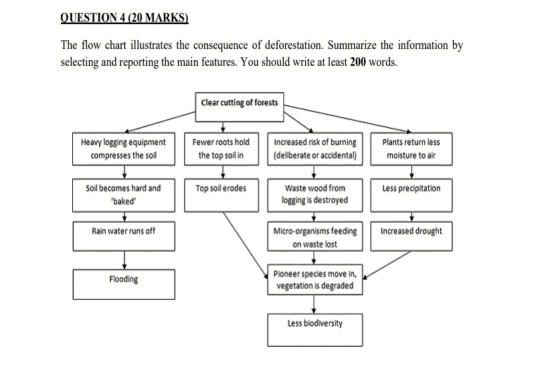
The data depicts the negative effect of cutting trees in the forest.
Overall
Linking Words
, what stands out from the data is that there are four different outcomes of deforestation and three of these results from the same event.
Firstly
Linking Words
, when trees are cut down it can lead to the compression of the soil
due to
Linking Words
the use of heavy logging equipment in which the soil becomes hard and baked. After which, rainwater can't be absorbed and
thus
Linking Words
will run off the earth which ends in flooding the nearby community.
Secondly
Linking Words
, fewer roots to hold the topsoil will
then
Linking Words
cause soil erosion.
Thirdly
Linking Words
, the risk of burning increases either deliberately or accidentally followed by the destruction of waste wood from logging, after that the food for the micro-organisms is lost.
Lastly
Linking Words
, the plants return less moisture to the air which
then
Linking Words
leads to less precipitation,
then
Linking Words
an increased drought.
Furthermore
Linking Words
, the consequences of
topsoilsoil
Correct your spelling
topsoil soil
erosion, loss of food for micro-organisms and increased drought are the moving in of pioneer species
as well as
Linking Words
the degradation of vegetation
thus
Linking Words
leading to lesser biodiversity.

Unauthorized use and/or duplication of this material without express and written permission from this site's author and/or owner is strictly prohibited. Excerpts and links may be used, provided that full and clear credit is given to Writing9 with appropriate and specific direction to the original content.

Linking words: Don't use the same linking words: "thus".
Introduction: The introduction is missing.
Introduction: The chart intro is missing.
Vocabulary: Only 4 basic words for charts were used.
Vocabulary: The word "data" was used 2 times.
Vocabulary: The word "increases" was used 3 times.
Topic Vocabulary:
  • flow chart
  • consequence
  • deforestation
  • process
  • cutting down
  • loss
  • forest cover
  • wildlife habitat
  • disruption
  • ecosystems
  • soil erosion
  • water quality
  • release
  • carbon dioxide
  • atmosphere
  • contribute
  • global warming
  • climate change
What to do next:
Look at other essays: