
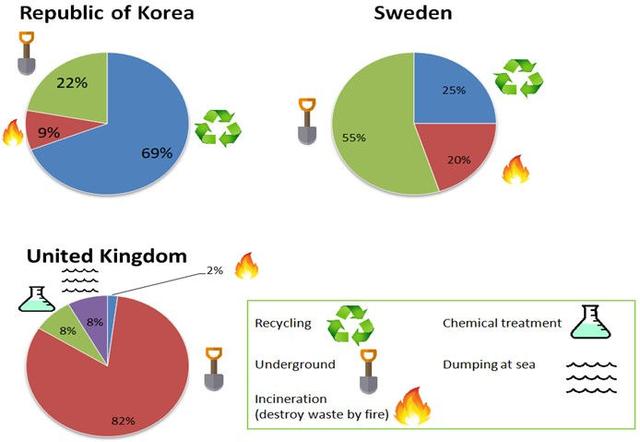
The pie charts illustrate the proportion of harmful waste which is dealt with by three nations
such
as Korea, Sweden and the UK.
Linking Words
Overall
, Linking Words
it is clear that
in the UK and Sweden, the majority of the harmful materials are buried underground, Linking Words
by contrast
, in the Republic of Korea, most of the hazardous products are recycled.
Looking at the information in detail, in the Republic of Korea, recycling is by far the most popular way that they deal with their unsafe garbage at almost 70%, Linking Words
while
landfill is the second with just under a quarter and 9% of waste damaged by fire.
Linking Words
According to
the United Kingdom and Swedeland, though they bury most of their hazardous rubbish underground as high as 82% and 55%, respectively, the second-ranking British have other methods like chemical treatment and dumping at sea, at 8% each, the other two countries do not have these methods, Linking Words
whereas
Swede recycles their junk at 25%. Linking Words
Additionally
, they destroy waste by fire the least at 20% for Sweden and merely 2% for the UK.Linking Words