
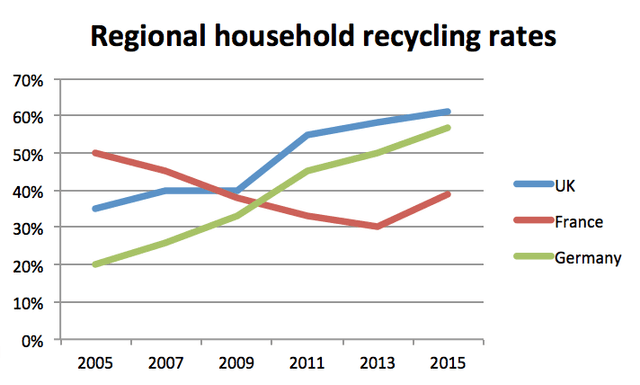
The line graph depicts the proportion of recycling the
households
in the Use synonyms
UK
, Use synonyms
France
and Germany between 2005 and 2015.
Use synonyms
Overall
it is noticeable that Linking Words
France
had the highest Use synonyms
percentage
of regional Use synonyms
households
before
2009 when the Use synonyms
UK
replaced it. Use synonyms
Moreover
, the Linking Words
UK
had the largest proportion of regional Use synonyms
households
, Use synonyms
while
the Linking Words
France
obtained lowest. Use synonyms
However
, the Linking Words
percentage
of the Use synonyms
UK
and Germany increased over the period in question, Use synonyms
while
Linking Words
France
decreased except final Use synonyms
years
.
Use synonyms
To begin
with the Linking Words
UK
, it increased steadily from 35 % in 2005 to 40 % in 2009 before going up to
55 % in 2011. Use synonyms
However
, it rose marginally to over 60 % in the final Linking Words
years
and had the highest Use synonyms
percentage
of recycling rates. The figure for Germany went up progressively from 20 % to under 60% in the final Use synonyms
years
.
With regards to Use synonyms
France
, it dropped gradually from 50 % to 30 % in 2013 before increasing to 40 % in the final Use synonyms
years
. Use synonyms
However
, it had the lowest Linking Words
percentage
of regional Use synonyms
households
over the period in question.Use synonyms