
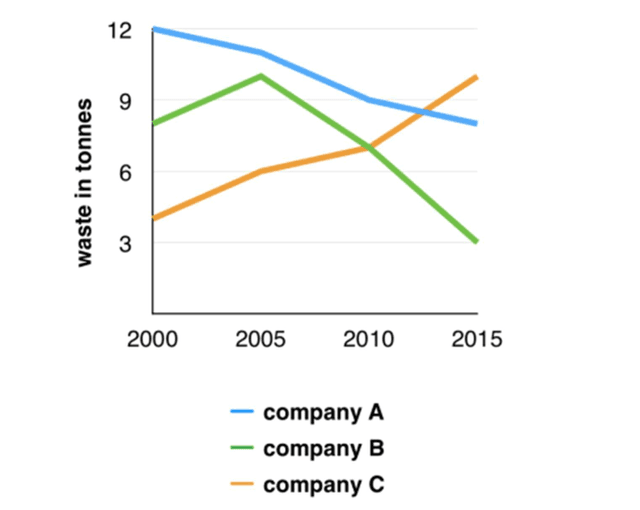
The line graph shown shows the amount of
waste
three companies wasted in tonnes, The line graph shows what changed in the companies' Use synonyms
waste
production over 15 years.
After looking at the chart you can say that Use synonyms
company
B has changed the most unlike their counterparties, Use synonyms
Further
inspection shows that the point where the Linking Words
waste
reduction happened was around 2005. Losing over six tonnes of Use synonyms
waste
in 10 years is a remarkable doing compared to the other two associations.
Use synonyms
While
Linking Words
Company
B took a positive route you can't say the same happened with Use synonyms
Company
A,
Unlike their counterparties Use synonyms
company
A’ٍٍs Use synonyms
waste
was up to 6 tonnes from 2000 to 2015. The most up in misuse was from 2010 to 2015.
Unlike the other two companies, the association took a slow approach. Even though the misuse reduction was slow it was a reduction Use synonyms
nonetheless
. Gradually lowering their Linking Words
waste
production by more than three tones in the 15 years the graph shows.Use synonyms