
The presented pie
chart
and bar graph provide information about the favourite Use synonyms
takeaways
in Canada and the number of Use synonyms
Indian
Use synonyms
restaurants
from 1960 to 2015. The flowchart includes 8 international ready-made foods, some were never ordered and others were not specified.
Use synonyms
Overall
, in the pie Linking Words
chart
, Chinese Use synonyms
food
has the greatest proportion of Use synonyms
food
Use synonyms
takeaways
Use synonyms
while
Greek, Japanese and Mexican Linking Words
food
got the least. The second most preferable takeout is Use synonyms
Indian
Use synonyms
food
. The bar graph showed almost continuous growth in the number of Use synonyms
Indian
Use synonyms
food
places in Canada for 55 years.
Looking into more detail, It was noticeable how Use synonyms
Indian
Use synonyms
food
got second place in the pie Use synonyms
chart
. Use synonyms
Indian
Use synonyms
restaurants
showed a considerable increase going from 3000 to more than 8000 in 2015. It reached its peak in 2009. After more than five decades, the number of Use synonyms
Indian
Use synonyms
restaurants
tallied in 2015 reached 9000 in total.
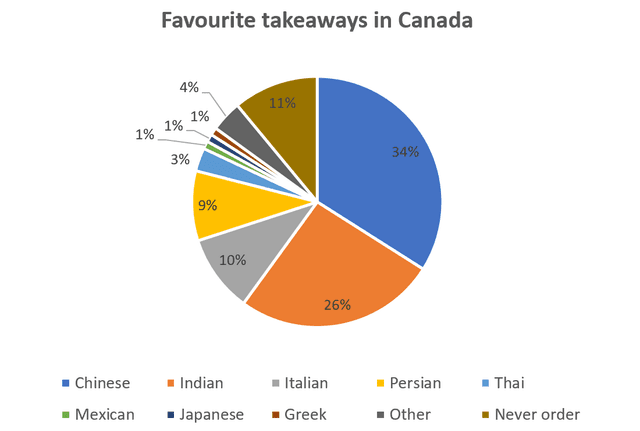
Use synonyms
On the other hand
, the circle graph shows how Chinese Linking Words
restaurants
were more popular for takeaway Use synonyms
food
with 34% whilst Mexican, Japanese and Greek Use synonyms
takeaways
were the less preferable options as they had 1% each. Other Use synonyms
takeaways
and Thai cuisines constitute 4% and 3% of the Use synonyms
chart
respectively. The second most common ready-made Use synonyms
food
was Use synonyms
Indian
with 26% followed by Italian Use synonyms
food
with 10% and Persian with 9%. Use synonyms
Finally
, those who never ordered were represented by 11%.Linking Words