
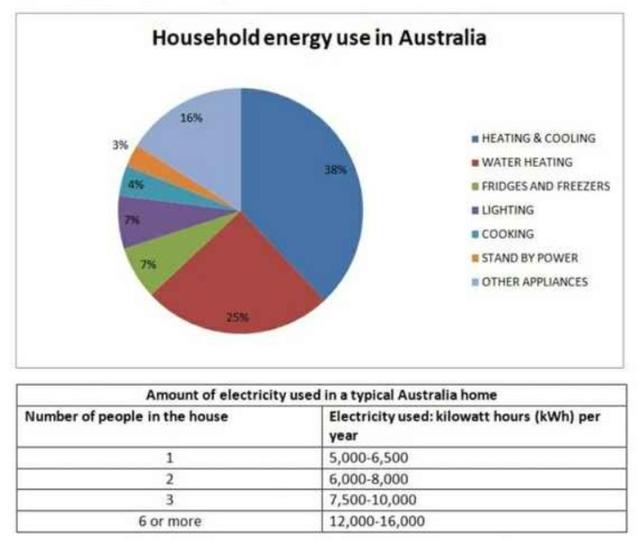
The pie chart depicts the share of the
energy
used in Use synonyms
Australian
households represented in percentage. The table illustrates the Use synonyms
amount
of Use synonyms
electricity
used in a year Use synonyms
according to
Linking Words
Use synonyms
number
of members in the Change the article
a number
the number
house
.
Use synonyms
Overall
, Linking Words
energy
is used in heating and cooling the most, Use synonyms
whereas
the smallest share of Linking Words
electricity
is used for Use synonyms
stand by
power. Add a hyphen
stand-by
Apparently
as the Add a comma
Apparently,
number
of Use synonyms
the
occupants increases, the Correct article usage
apply
amount
of Use synonyms
energy
used in an Use synonyms
Australian
household increases.
Most of the Use synonyms
electricity
is used in heating and cooling the most at 38 per cent followed by water heating which uses a quarter of the total Use synonyms
energy
. Use synonyms
Australian
people use 7 per cent of Use synonyms
the
Change the word
their
energy
in lighting Use synonyms
likewise
fridges and freezers. Among all of the ways Linking Words
energy
is consumed in Use synonyms
Australian
houses, Use synonyms
stand by
power uses the least Add a hyphen
stand-by
energy
at merely 3 per cent.
The Use synonyms
amount
of Use synonyms
electricity
used by 1 person in a Use synonyms
house
is 5000 to Use synonyms
6500 kilowatt
hours yearly, and Add a hyphen
6500-kilowatt
this
Linking Words
number
rises to 12,000 to 16,000 when the Use synonyms
number
of occupants is 6 or more. Use synonyms
Nonetheless
, the Linking Words
amount
of Use synonyms
energy
used in the Use synonyms
house
that has 6 members is actually less than the Use synonyms
house
having 1 member.Use synonyms