
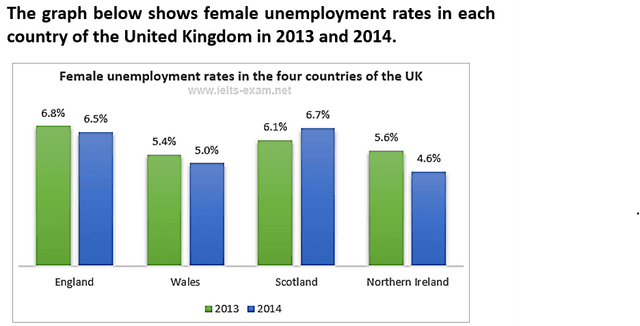
The unemployment rate for females is illustrated in the following bar chart between 2013 and 2014 in four different nations of the UK.
In general, it can be seen that the proportion of unemployment among women in England, Wales and Northern Ireland had seen a small decline during the period.
However
, the rates in Scotland were the stablest country which increased slightly from 2013 to 2014.
Linking Words
According to
the graph, the proportion of England females was the highest in all four countries with approximately 7 per cent in 2013. In the same year, the figure for Scotland was just less than England at 0.7 per cent. Two other countries, Wales and Northern Ireland, had 5.4% and 5.6% respectively.
The period in 2014 witnessed a slight decline by a minority percentage of unemployed British women. Both the figure for Wales and North Ireland had a considerable drop down in that time. Linking Words
While
the rate in Scotland increased steadily and became the highest in all with 6.7 per cent Linking Words
at the end
of the period.Linking Words