
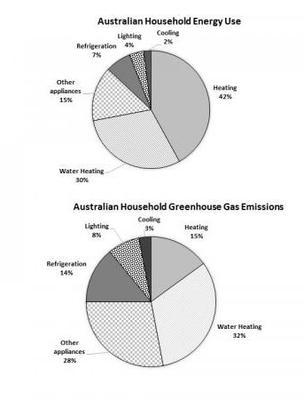
The given pie charts depict the average number of
energy
used by Use synonyms
Australian
households and the greenhouse gas emissions resulting from Use synonyms
energy
Use synonyms
use
.
Use synonyms
Overall
, heating made up as the biggest contributor to Linking Words
energy
Use synonyms
use
, Use synonyms
while
water heating constitutes the greenhouse gas emissions biggest proportion among Linking Words
Australian
households.
Starting with the first pie chart explains the data on Use synonyms
Australian
households using Use synonyms
energy
. Heating was in the first position of contributor at 42%, followed by Water heating at third-tenths. The proportion of other appliances stood as the third contributor to Use synonyms
energy
Use synonyms
use
at 15%. Use synonyms
Then
, refrigeration and lighting contribute 7% and 4%, respectively. Linking Words
In addition
, cooling only contributes a tiny fraction.
Moving on to the second pie chart, water heating stood as the biggest proportion of greenhouse gas emissions at 32%. Linking Words
Moreover
, other appliances contribute roughly a quarter. Linking Words
Next,
heating and refrigeration constitute similar percentages at 15% and 14%, respectively. Linking Words
Additionally
, lighting made up 8%, Linking Words
while
cooling same as the Linking Words
Australian
households’ Use synonyms
energy
Use synonyms
use
contributing only 3%.Use synonyms