
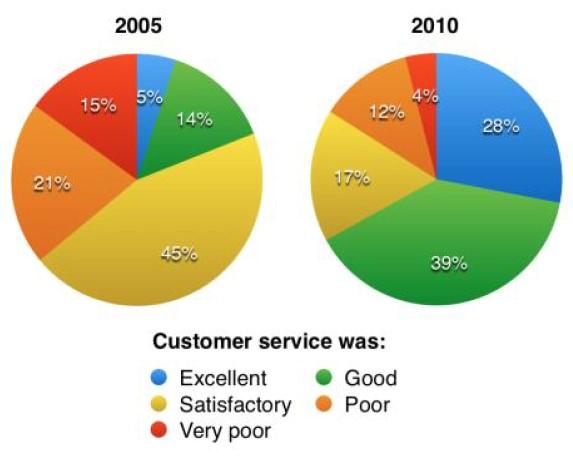
The pie charts illustrate how extent of customer satisfaction with quality services at the Parkway Hotel through surveys conducted in 2005 and 2010.
Overall
, there was a significant decline in the proportion of guests’ unsatisfactions in 2010, Linking Words
while
a progressive soar can be seen in the fulfilment attitudes of examined clients.
The percentage of hotel visitors rated quality services as excellent started at 5%, followed by a significant rise to 28% in 2010. Linking Words
Furthermore
, only 14% of guests described customer service in the hotel as good in 2005, before having a subsequent threefold increase to 39% in 2010. Linking Words
Additionally
, the figure for people who gave a 'satisfactory' vote declined significantly from 45% to 17% over the period.
There was an almost halved drop from the figure of poor voted to 12% in 2010. A similar change can be seen in the figure for people who thought customer service to be very poor, which dropped from 15% to only 4% in 2010.Linking Words