
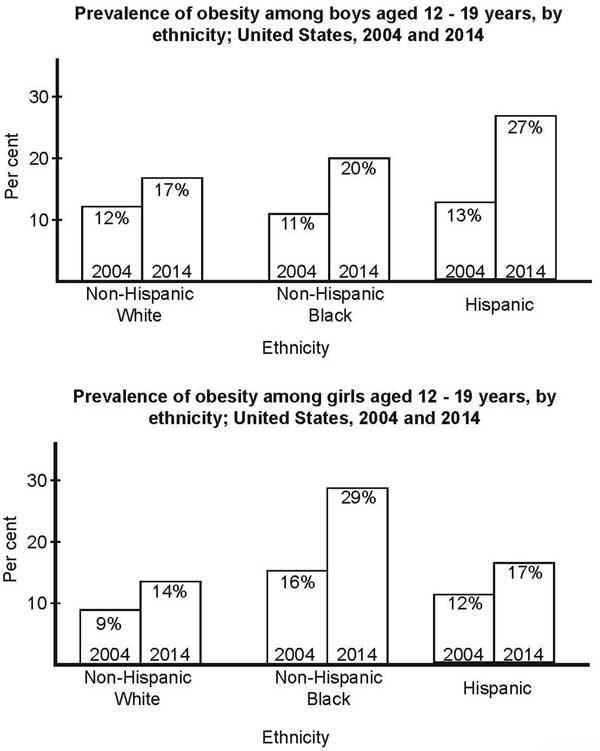
Bar charts illustrate the details about the level of overweight in 2 different genders from 12 to 19 years old of populations in US for the two decades (2010 and 2014).
Overall
, in both genders, there were more higher in 2014 than in 2004. Linking Words
Furthermore
, Linking Words
while
the figures Linking Words
of
male Change preposition
for
in
Change preposition
apply
Hispanic
in 2014 was the highest, in 2014, Fix the agreement mistake
Hispanics
non-Hispanic
black was the highest among females.
As we can be seen from the male's graph, Use synonyms
Linking Words
while
Correct word choice
apply
non-hispanic
black, Use synonyms
non-hispanic
white and Hispanic in 2004 were 11%, 12%, and 13% , respectively. There was a dramatic increase in 2014 which were 20%, 17%, and 27%, following those order. Use synonyms
Moreover
, Hipanic was the highest among these categories at 13% in 2004 and 27% in 2014.
In marked contrast, the level of obesity among females was the highest with non-HispanicHispanic Black at 29% in 2014 and Hispanic at 17% in 2004. Linking Words
In addition
, in 2004, Linking Words
non-Hispanic
white was at the bottom of the bar chart at 9% of obese girls in the United States.Use synonyms