
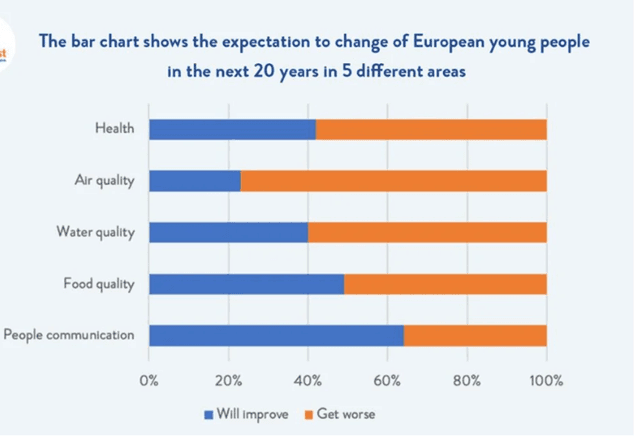
The bar chart demonstrates the European young generation’s views towards changes in the coming 20 years across five different areas namely health, air quality, water element, food quality and people communication.
Overall
, the majority of the surveyed youth expect that, Linking Words
besides
the communication among residents , all other aspects of life will get worse.
In detail, air quality receives the worst outlook, with around 75% of believers in their declines. Linking Words
This
figure triples that of people who think Linking Words
otherwise
. Linking Words
Similarly
, it is believed by around 60% of European youth that water condition, Linking Words
as well as
,health is going to plummet.
Linking Words
On the contrary
, Linking Words
although
close to three-fourths of the participants in the survey state expect to see improvements in population communication, the rest remain in disbelief. Food element is the category, which receives a mixed response among the surveyed population, with virtually more than half of the people saying it will get better Linking Words
while
others think Linking Words
conversely
Linking Words