
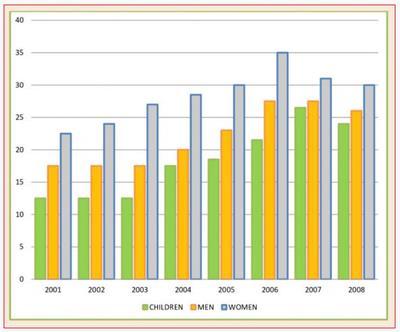
The bar graph depicts information on the proportion of British people who eat five servings of
fruit
and Use synonyms
vegetables
a day between 2001 and 2008.
Use synonyms
Overall
, the majority of UK citizens consuming Linking Words
fruit
and Use synonyms
vegetables
were women. A lesser percentage of Use synonyms
children
ate Use synonyms
fruit
and Use synonyms
vegetables
in comparison to adults. In general, the numbers increased steadily over the years amongst all the groups.
Approximately, around 10% of Use synonyms
children
and 15% of men consumed fruits and Use synonyms
vegetables
in the initial 3 years, which gradually rose, peaking at over 25% in 2006 and 2007 for men and Use synonyms
children
respectively, after which the graph began to fall till 2008.
Women, Use synonyms
on the other hand
, continued to be on the higher side all throughout the years, starting at around 20% of the population eating Linking Words
fruit
and Use synonyms
vegetables
in 2001. Use synonyms
This
figure rose steadily, reaching 25% in 2003 and over 30% in 2006, at which point it peaked. The numbers Linking Words
then
experienced a slight decline after the peak, similar to the trend in men and Linking Words
children
.Use synonyms