
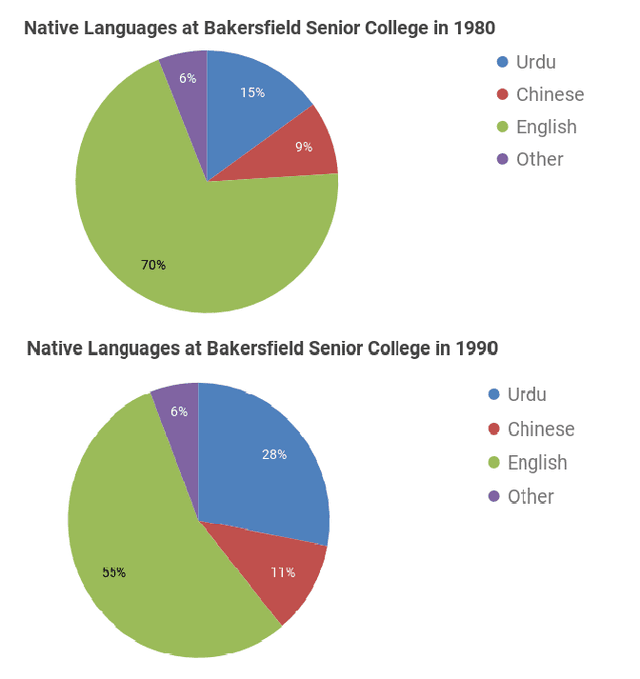
The pie chart illustrates the percentage of people who speak different languages which are ,
English
, Use synonyms
Urdu
, Chinese and others. at Bakersfield Senior College in 1980 compared with 1990 .
Use synonyms
overall
, we can clearly see, the difference between the two years , that, the proportion of the Linking Words
English
language most students speak , and Use synonyms
Urdu
Use synonyms
also
many students have been speaking since 1990 .
Linking Words
According to
the pie chart , we can observe the number of pupil's have spoken Linking Words
English
was a high rate among the other languages , with 70% in 1980 Use synonyms
then
55% in 1990 and Chinese and Linking Words
Urdu
, Use synonyms
Moreover
, Linking Words
Urdu
has become Figure 28% in 1990 it has increased from 9% to 28%, For Use synonyms
this
results, the clear is the Linking Words
English
language more growing by the time.Use synonyms