
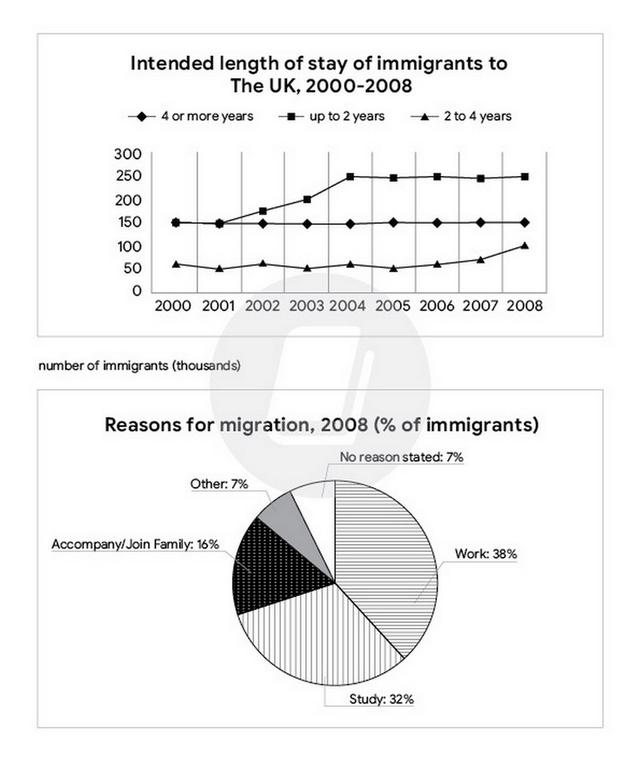
The line
chart
compares the amount of time migrants to the UK wanted to stay over an Use synonyms
8 year
period. Add a hyphen
8-year
Moreoever
, the pie Correct your spelling
Moreover
chart
illustrates why Use synonyms
people
decided to immigrate in the year Use synonyms
of
2008.
In the line Change preposition
apply
chart
, we can see Use synonyms
although
the number of Linking Words
people
who intended to stay for less than two years was stable for the first two years, it rose and became the Use synonyms
most
favourite option for immigrants. Correct quantifier usage
apply
Also
in the pie Linking Words
chart
, work was stated as the main reason for immigration.
In the year 2000, Use synonyms
people
who migrated for a shorter period of time had the same figure as the Use synonyms
long term
migrants; both roughly at 150 Add a hyphen
long-term
thousand
Use synonyms
people
, Use synonyms
while
a little over 50 Linking Words
thousand
Use synonyms
people
wanted to stay between 2 to 4 years. Use synonyms
Short term
immigrants began to increase in 2001 and rose to almost 250 Add a hyphen
Short-term
thousand
Use synonyms
people
in 2004 and stayed at the same figure since Use synonyms
then
. Linking Words
However
, the number of Linking Words
people
in the other two groups almost did not change, Use synonyms
mid term
migrants' figure fluctuated and Add a hyphen
mid-term
finally
, increased to 100 Linking Words
thousand
Use synonyms
people
in 2008.
In the second Use synonyms
chart
, it is shown that work and studying combined for merely 70 Use synonyms
percent
of the reasons for immigration in 2008; 38 Change the spelling
per cent
percent
of which is accounted by work to be Change the spelling
per cent
percise
. Correct your spelling
precise
People
who wanted to join their family were the third most prevalent with 16 Use synonyms
percent
Change the spelling
per cent
while
the remaining 14 Linking Words
precent
was split up between Correct your spelling
per cent
people
who chose other reasons or, did not want to answer Use synonyms
this
question.Linking Words