
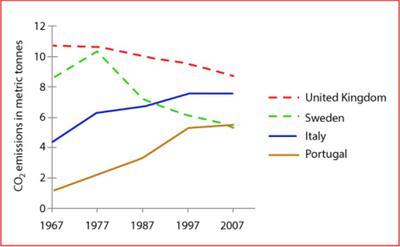
The display graph shows average carbon dioxide (CO2) emissions per person in the United Kingdom, Sweden, Italy, and Portugal between 1967
as well as
2007.
Carbon dioxide emissions in metric tonnes, in the United Kingdom, in 1967 there Linking Words
was
around 11, in 1977 there were 10, in 1987 there were nearly 10, in 1997 there Correct subject-verb agreement
were
was
more than 9 and in 2007 there Correct subject-verb agreement
were
was
9. In Sweden, in 1967 it was more than 8 but later in 1977, it was increased by 10 and in 2007 it was 6. In Italy, in 1967, it was more than 4, Correct subject-verb agreement
were
then
later on by 2007 it became 8. In Portugal, in 1967 it was 1 it kept on increasing from 1977 till 6 by 2007. In Portugal and Linking Words
Italy
it was increasing.
Add a comma
,Italy
To conclude
, the above information describes 4 countries the United Kingdom, Sweden, Italy and Portugal. The data is from 1967 to 2007.Linking Words