
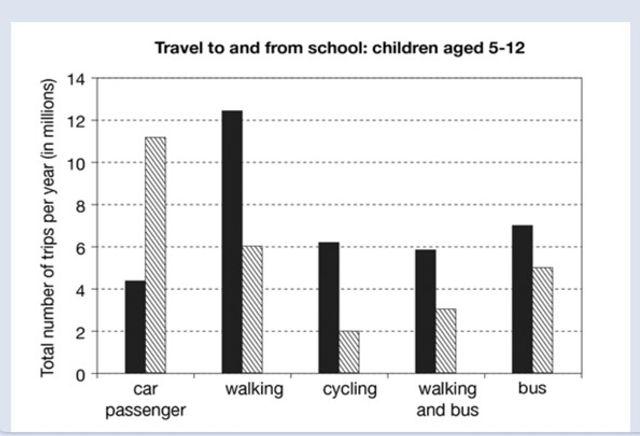
The chart gives information about how many trips were made by children to and from the school in 1990 and 2010.
Overall
, the most popular type of transport in 2010 was an automobile, Linking Words
while
in 1990 pupils preferred to walk. Turning to the details, In 1990, the great majority of people used to walk rather than travel by car, bike or other type of vehicle. Bus transportation gained the second place of favorability, Linking Words
whereas
cycling with 6 million trips came in 3rd place. It is obvious that in 2010 Linking Words
this
trend changed and students started to use automobiles with almost 11 million Linking Words
travel
per year. In comparison, walking had only half of that popularity with 6 million respectively. The usage of the bus gained third place, which shows a downward trend. So, the trips by car showed the opposite situation, as the number of passengers has been growing steadily. Correct your spelling
travelling
Although
walking was the most popular in 1990, by 2010, it had become less popular compared to other types of transport.Linking Words