
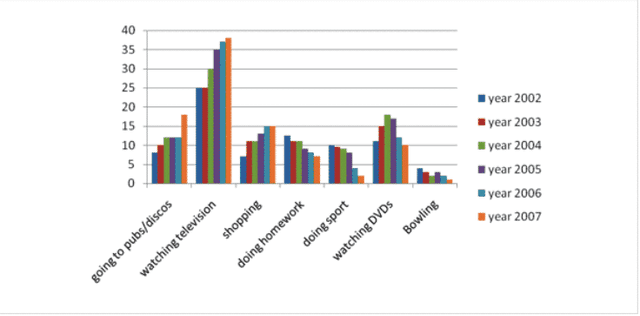
The diagram illustrates the number of hours per week that youths spent participating across seven enterprises in Chester from 2002 until 2007.
Overall
, the histogram demonstrates the three activities out of seven that gained favourable over six-year periods, contrary to the rest four domains that are less popular throughout the reporting period.
Observing the details, it is remarkable that there was a dramatic rise in younger generations participating in watching TV, increasing from 25% in 2002 to 38% in 2007. Comparably, teens spent time on clubbing and shopping which grew gradually three times more than it was in 2002.
Linking Words
On the contrary
, the rest four enterprises demonstrated the reduction. Noticeably, teenagers spending time watching DVDs slightly increased to around 18% in 2004 and 2005 but unfortunately fell to 10% in 2007. Considering that doing homework and sports slowly declined till 2007. Interestingly, bowling remained the least favourite domain with only 4% of youths joining and just 1% taking part in 2007.Linking Words