
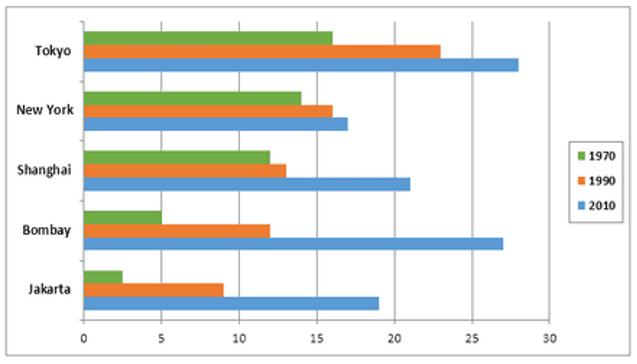
The display charts provide information on the population in some of the world's largest cities and the population distribution in urban
as well as
rural areas.
In the year 1970, in Tokyo it was more than 15, in New Linking Words
York
it was around 15, in Use synonyms
Shanghai
it was between 10-15, in Use synonyms
Bombay
it was 5 and in Use synonyms
Jakarta
it was 3. In the year 1990, in Tokya it was the highest with 22, in New ,Use synonyms
York
it was 16, in ,Use synonyms
Shanghai
it was 21 and in ,Use synonyms
Bombay
it was 12, in ,Use synonyms
Jakarta
it was 9. In the year 2010, in Tokyo it was the highest at 28, in New Use synonyms
York
it was 16, in ,Use synonyms
Shanghai
it was 21, in Use synonyms
Bombay
it was 28 and in ,Use synonyms
Jakarta
it was 18.
Use synonyms
To conclude
, the data on population in the years 1970, 1990 and 2010 from the world's largest cities are Tokyo, New Linking Words
York
, Use synonyms
Shanghai
, Use synonyms
Bombay
and Use synonyms
Jakarta
.Use synonyms