
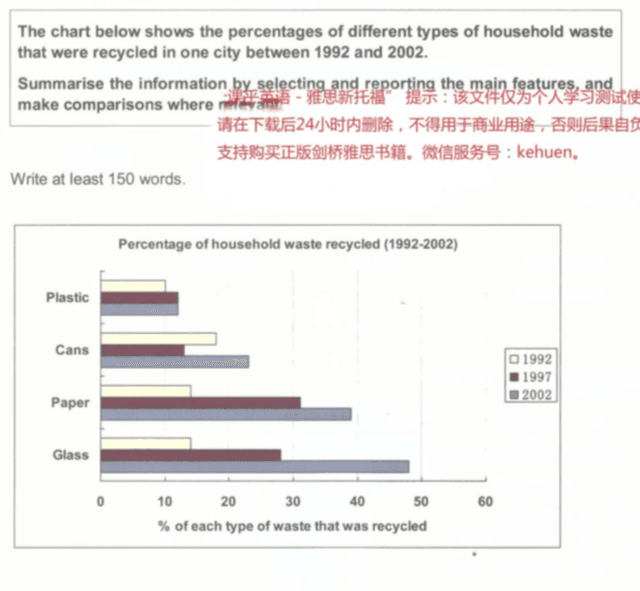
The diagram below illustrates the fraction of waste types in households which will be recycled in one nation over ten-year periods.
Overall
, the years are taken into consideration starting from 1992 to the end of the period of time of 2002. Linking Words
Additionally
, all of the waste soared to reach its peak.
Observing the details, it is remarkable that there was a dramatic change in the glass category which rose more than a half in 1992. Comparably, in 1992 cans had the highest rate of recycling utilization followed by paper and glass Linking Words
whereas
plastic was on the lowest level. Linking Words
Nevertheless
, the percentage of glass climbed up to 28% in 1997 and reached 48% in 2002. Linking Words
As well as
paper which reached 30% in 1997 and 40% in 2002.
Linking Words
On the contrary
, cans and plastic didn't significantly increase as the rest. In 1997, cans fell from 20% to 15% and reached a peak at 25% in 2002. Linking Words
However
, plastic gradually and slightly rose from 10% in 1992 to 12% in 1997 and remained the same in 2002.Linking Words