
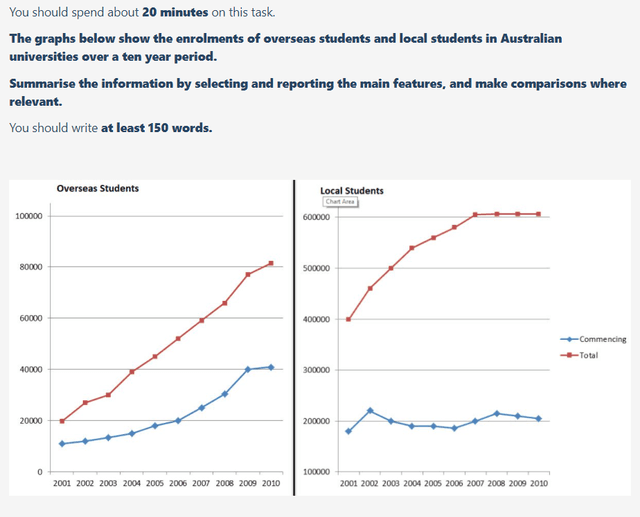
The line graphs illustrate the sum of the international and domestic admissions at Australian Universities and how many were registered in each year between 2001 and 2010.
Overall
, it can be clearly seen thatLinking Words
,
the total numbers of foreigners were higher than the locals and both categories experienced an upward trend. Regarding, the recruitment, of undergraduates who came from overseas each year gradually increased Remove the comma
apply
whereas
for natives it did not improve throughout the period.
When turning to the Australian nations, 400000 were starting their higher education in 2001. Linking Words
In contrast
, twenty times fewer than that of numbers outsiders came to Australia in the same year. Linking Words
However
, the total number of overseas students increased rapidly up to 80000 Linking Words
at the end
of the period. When considering the domestic students, Linking Words
this
figure climbed to 600000 in 2008 and for the rest of the two ,years it remained unchanged.
Linking Words
According to
the annual commencing of students, Linking Words
although
registration of candidates from foreign countries showed a rapid improvement over the period, candidates from Australia did not enhance their amount significantly. In the beginning,about 10,000 registrations were completed and ended up with 40000 Linking Words
at
2010.Change preposition
in