the graph below shows radio and television audiences through out the day in 1992. Summarize the finformation by selecting and reporting the main freatures, and make compraions where relevant.

the graph below shows radio and television audiences through out the day in 1992. Summarize the finformation by selecting and reporting the main freatures, and make compraions where relevant.
The display graph shows radio
as well as
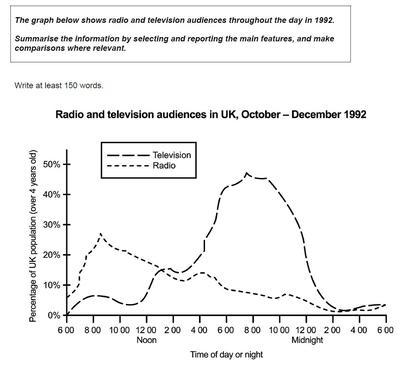
television audiences throughout the day in the UK, in October- December 1992. In television, in noon, at 6:00 it was around 1%, at 8:00 it was 5%, at 10:00 it was nearly 5%, at 12:00 it was 10%, in midnight, at 2:00 it was 15%, at 4:00 it was 20%, at 6:00 it was 30%, at 8:00 it was 40%, at 10:00 it was around 35%, at 12:00 it was 10% and at 6:00 it was 1%. In radio, at 6:00 it was 8%, at 8:00 it was 15%, at 10:00 it was 20%, at 12:00 it was 15%, at 2:00 it was 10%, at 8:00 it was 7%, at 10:00 it was 5%, at 2:00 it was 1%, at 4:00 it was 1% and at 6:00 it was 1%.
To conclude
, the above information describes radio and television aduience through out the day.
Submitted by purvaam383 on

Unauthorized use and/or duplication of this material without express and written permission from this site’s author and/or owner is strictly prohibited. Excerpts and links may be used, provided that full and clear credit is given to Writing9 with appropriate and specific direction to the original content.

Sentences: Add more complex sentences.
Vocabulary: Rephrase your introduction. Words match: 71%.
Vocabulary: Rephrase the word "undefined" in your introduction.
Vocabulary: The word "around" was used 2 times.
What to do next:
Look at other essays: