
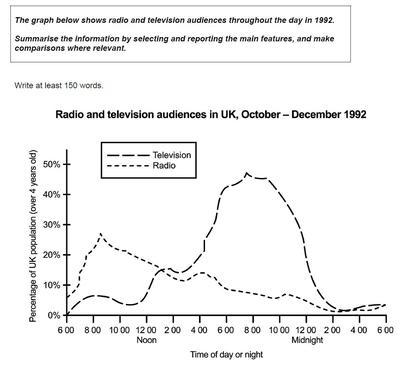
The chart illustrates information about
radio
and television users along the day in 1992. Use synonyms
Overall
, it can clearly be seen that the television and Linking Words
radio
reached a peak at 8.00 PM and 9.00 AM respectively. Use synonyms
Nevertheless
, the trend was slightly similar Linking Words
according to
the line graph.
In terms of the communication tool with the highest percentage at the start, the amount of Linking Words
radio
users stood at exactly 6% at 06.00 o'clock. Use synonyms
Furthermore
, the Linking Words
radio
experienced a dramatic increase until attained its highest point at 8.00 AM which contributed to almost one-third. Use synonyms
However
, the Linking Words
radio
decreased sharply during Use synonyms
the
midnight to the lowest part which made up just below 5% at 06.00 AM.
Regarding the other telecommunication tool, television participants started at 0% population at 6.00 AM. Correct article usage
apply
Moreover
, the trend experienced a rapid climb until reached its climax at 8.00 AM which accounted for around 50%. Linking Words
On the other hand
, it fell quickly to the Linking Words
least
part which constituted Correct word choice
lowest
to
0%.Change preposition
apply